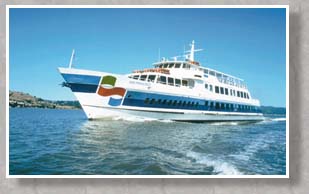
Annual Ridership
Fiscal Year
(ending June 30) |
Annual Ridership |
Average Daily Ridership
(All Routes) |
All Routes |
Larkspur* |
Sausalito |
Tiburon† |
Weekday |
Saturday |
Sunday/
Holiday |
FY 2018 |
2,578,137 |
1,660,272 |
726,010 |
191,855 |
8,509 |
4,383 |
3,621 |
FY 2017 |
2,523,077 |
1,692,741 |
768,942 |
61,394 |
8,203 |
4,585 |
3,747 |
FY 2016 |
2,545,122 |
1,753,484 |
791,638 |
n/a |
8,204 |
4,843 |
3,898 |
FY 2015 |
2,540,691 |
1,727,872 |
812,819 |
n/a |
8,219 |
4,953 |
4,083 |
FY 2014 |
2,470,583 |
1,677,050 |
793,533 |
n/a |
7,812 |
4,861 |
4,172 |
FY 2013 |
2,324,874 |
1,605,989 |
718,885 |
n/a |
7,465 |
4,482 |
3,685 |
FY 2012 |
2,195,414 |
1,526,375 |
669,039 |
n/a |
7,016 |
4,116 |
3,488 |
FY 2011 |
2,031,219 |
1,432,039 |
599,180 |
n/a |
6,532 |
3,615 |
3,237 |
FY 2010 |
1,922,095 |
1,338,764 |
583,331 |
n/a |
6,057 |
3,779 |
3,341 |
FY 2009 |
1,949,035 |
1,370,400 |
578,635 |
n/a |
6,273 |
3,681 |
2,999 |
FY 2008 |
1,979,843 |
1,414,588 |
565,255 |
n/a |
6,340 |
3,535 |
3,259 |
FY 2007 |
2,024,935 |
1,477,762 |
547,173 |
n/a |
6,590 |
3,561 |
3,015 |
FY 2006 |
1,870,169 |
1,402,668 |
467,501 |
n/a |
6,099 |
3,075 |
2,876 |
FY 2005 |
1,750,678 |
1,335,816 |
414,862 |
n/a |
5,719 |
2,997 |
2,549 |
NOTES:
* Larkspur ridership figures include special services such as service to San Francisco Giants baseball games at Oracle Park.
† Tiburon commute service began March 6, 2017.
|
Annual Ridership (Historical)
Fiscal Year
(ending June 30) |
Annual Ridership
(All Routes) |
Average Weekday Ridership
(All Routes) |
Comments |
FY 2004 |
1,660,369 |
5,349 |
- |
FY 2003 |
1,596,121 |
5,224 |
- |
FY 2002 |
1,652,420 |
5,538 |
- |
FY 2001 |
1,885,618 |
6,231 |
- |
FY 2000 |
1,857,355 |
6,192 |
March 2000, service starts from Larkspur to AT&T Park (then called Pac Bell Park) for San Francisco Giants baseball games. |
FY 1999 |
1,670,620 |
5,566 |
- |
FY 1998 |
1,554,493 |
5,137 |
- |
FY 1997 |
1,509,886 |
4,951 |
- |
FY 1996 |
1,429,549 |
4,599 |
- |
FY 1995 |
1,332,158 |
4,317 |
- |
FY 1994 |
1,403,830 |
4,519 |
- |
FY 1993 |
1,466,050 |
4,676 |
- |
FY 1992 |
1,524,000* |
- |
- |
FY 1991 |
1,506,000* |
- |
- |
FY 1990 |
1,624,000* |
- |
In November and December 1989, following the October 17, 1989, Loma Prieta Earthquake, ferry ridership increased by 60%. |
FY 1989 |
1,495,000* |
- |
- |
FY 1988 |
1,452,000* |
- |
- |
FY 1987 |
1,439,000* |
- |
- |
FY 1986 |
1,279,000* |
- |
- |
FY 1985 |
1,126,000* |
- |
December 1983 to November 1985, the three Spaulding vessels were sequentially taken out of service to be converted from gas turbine to diesel to cut operating costs. |
FY 1984 |
1,025,000* |
- |
FY 1983 |
1,070,000* |
- |
FY 1982 |
1,274,671 |
- |
Ferry ridership records were set during the January 1982 storms in Marin County. |
FY 1981 |
1,816,731 |
- |
- |
FY 1980 |
1,117,508 |
- |
- |
FY 1979 |
2,059,908 |
- |
During the fuel crisis in 1978/1979, a ridership record was set in May 1979, when ferries carried 53,271 passengers in a week. |
FY 1978 |
2,142,448 |
- |
- |
FY 1977 |
1,708,321 |
- |
December 1976, service starts from Larkspur to San Francisco. |
FY 1976 |
1,103,810 |
- |
- |
FY 1975 |
1,087,804 |
- |
- |
FY 1974 |
1,061,494 |
- |
- |
NOTE: * indicates ridership is rounded |
Highest Ridership Days
|
Larkspur |
Sausalito |
Total
|
Friday, July 21, 2006
Spare the Air Day (free rides by MTC/BAAQMD) |
13,340 |
11,559
|
24,899
|
Friday, June 23, 2006
Spare the Air Day (free rides by MTC/BAAQMD)
|
10,522 |
6,295
|
16,817
|
January 6, 1982
Major Flooding in Marin County |
12,275 |
4,118 |
16,393
|
Wednesday, October 31, 2012
World Champion San Francisco Giants Parade and Celebration |
14,099 |
2,099 |
16,198 |
November 3, 2010
Giants World Series Victory Parade & Celebration |
12,823 |
2,296 |
15,119 |
Friday, October 31, 2014
World Champion San Francisco Giants Parade and Celebration |
10,622
|
1,365 |
11,987 |
July 30, 1977
A hot summer day
|
4,339 |
6,519 |
10,858
|
Saturday, April 28, 2012
South approach to the Golden Bridge, Doyle Drive, was closed for demolition
|
6,175 |
3,805 |
9,980 |
Sunday, April 29, 2012
South approach to the Golden Bridge, Doyle Drive, was closed for demolition |
6,193 |
3,340 |
9,534 |
Saturday, October 6, 2012 Multiple events in San Francisco with Fleet Week, America’s Cup, Hardly Strictly Bluegrass, SF Giants Playoff game, and more |
6,266 |
3,090 |
9,356 |
Saturday, January 10, 2015
The Golden Gate Bridge was closed to install a moveable median barrier |
5,617 |
3,308 |
8,925 |
Sunday, October 7, 2012
Multiple events in San Francisco with Fleet Week, America’s Cup, Hardly Strictly Bluegrass, SF Giants Playoff game, and more
|
4,687 |
2,250 |
7,937 |
Ridership on Larkspur/San Francisco Giants Baseball Service
Season |
Ridership |
2018 |
53,125 |
2017 |
66,394 |
2016 |
77,683 |
2015 |
75,601 |
2014 |
79,307 |
2013 |
80,782 |
2012 |
92,299 |
2011 |
94,385 |
2010 |
87,456 |
2009 |
64,797 |
2008 |
63,321 |
2007 |
72,617 |
2006 |
80,844 |
2005 |
78,399 |
2004 |
90,589 |
2003 |
55,133 |
2002 |
105,962 |
2001 |
79,815 |
2000 |
83,300 |
NOTE: Ridership figures are for San Francisco Giants baseball games only and do not include other special event service.
Each season typically runs from April through September.
|